

Getting Started
Built by @tedx_ai, BrowserTools MCP streams console output, network activity, screenshots and Lighthouse audits from your real Chrome session — the one already logged into your app — to any MCP-compatible client. That means you can simply tell Cursor, Claude Code or any AI code editor with MCP support:Version 2.0 is a rewrite. One process instead of three, no unauthenticated
local server, and credentials scrubbed before they leave the browser. Coming
from 1.x? Read the migration guide — and upgrade, because 1.2.x
has a critical vulnerability.
Requirements
- Node 22.19 or newer — check with
node --version - Google Chrome or a Chromium-based browser
- An MCP client (Cursor, Claude Code, Windsurf, Cline, RooCode, Zed, Claude Desktop, Gemini CLI)
If you use nvm, asdf or a similar version manager, make sure your editor
inherits the same Node version you see in your terminal. A client launched
from the macOS Dock often does not.
Installation
There are two pieces: an MCP server (one command) and a Chrome extension. There is no second server to start — in 2.0 the MCP server runs the browser connector itself.1. Point your MCP client at the server
Most clients take the same JSON. Give the server a name (browser-tools), set the command to npx and the args as below:
Use
@latest. Earlier versions of these docs pinned @1.2.0. That
version contains a critical vulnerability — do not pin to it.2. Install the Chrome Extension
Clone the repository, then load thechrome-extension directory as an unpacked extension:
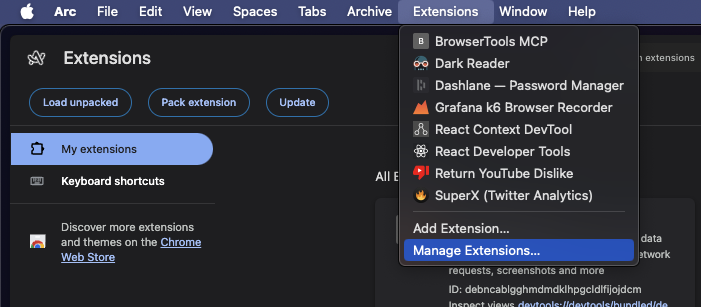
2a. Open ‘Manage Extensions’
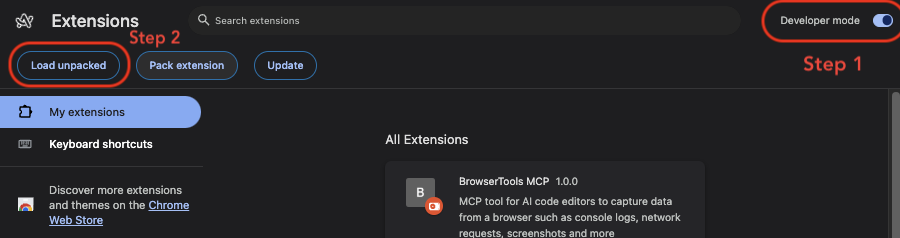
2b. Enable ‘Developer Mode’ and click ‘Load unpacked’
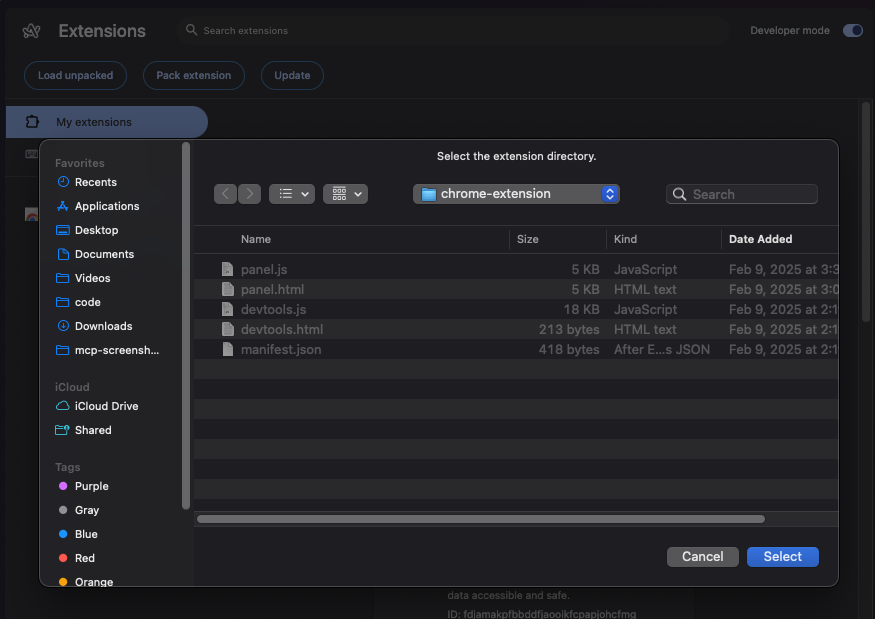
2c. Select the chrome-extension directory inside the repo you just cloned. You should see BrowserToolsMCP in your list of extensions now!
3. Open the Chrome Developer Console
Right click on any web page and click ‘Inspect’. Capture begins as soon as DevTools is open — in 1.x you had to select the BrowserTools panel first, which is no longer true.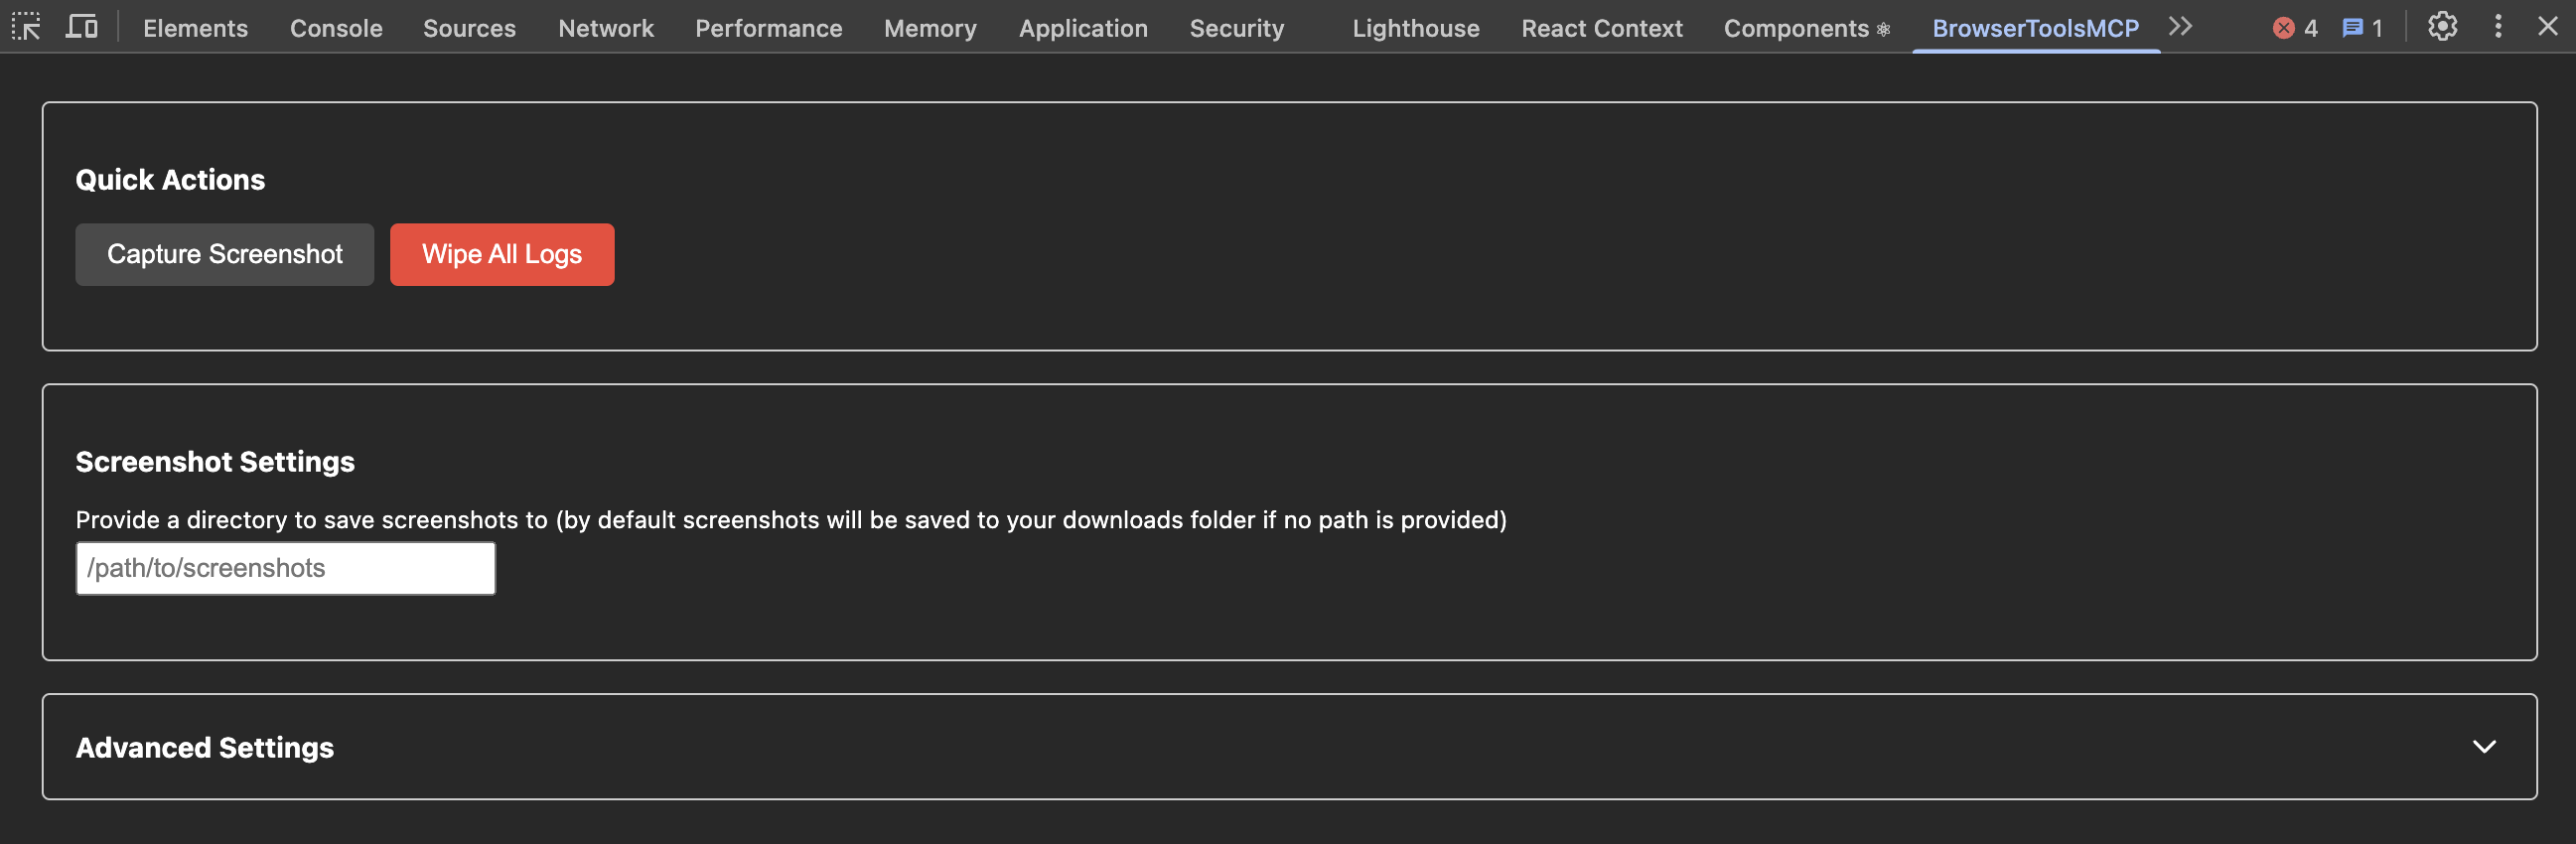
- See whether the extension is connected, and to which port
- Change the connector host and port, and reconnect
- Choose what to capture: console, network, response bodies, request/response headers
- Switch console capture mode between the DevTools protocol and wrapping the page console
- Grant optional cookie access
- Adjust log, query and string size limits
Network capture starts when DevTools opens. Requests that finished before then
are not recorded — reload the page to capture a full page load.
4. Check that it works
Run the built-in diagnostic from any terminal:--verbose:
Congratulations! You’ve successfully installed and configured BrowserTools 🎉 Check out the Quickstart Guide to learn how to use it, or the tools reference for everything your agent can call.
Troubleshooting
Start with--doctor. It checks every part of the setup and names the one that is broken:
- Check that the MCP server registered in your client and shows its tools
- Check that the extension is loaded and DevTools is open on the tab you want to capture
- Look through the common issues below
--doctor output and those logs, and we’ll get back to you as soon as possible.
Common Issues & Errors
Error: my client says it can't find npx
Error: my client says it can't find npx
On Windows, set
"command": "cmd" with "args": ["/c", "npx", "-y", "@agentdeskai/browser-tools-mcp@latest"].Elsewhere, this usually means your editor is running a different Node than
your terminal. Find the absolute path with which npx and use that as the
command.Issue: the server doesn't show up in Claude Code's /mcp list
Issue: the server doesn't show up in Claude Code's /mcp list
Almost always scope. If that prints an empty list, remove it and re-add with Then restart Claude Code.
claude mcp add without -s user registers the server
only for the directory you ran it in, so it is invisible from every other
project — including when the directory you ran it in was your home folder.Check where it landed:-s user:claude mcp list shows what the current directory
can actually see.Error: this package requires Node >=22.19
Error: this package requires Node >=22.19
2.0 requires Node 22.19 or newer — Lighthouse 13 and the current toolchain
need it. Upgrade Node, and make sure your editor inherits the new version.
Issue: I'm still being told to run browser-tools-server
Issue: I'm still being told to run browser-tools-server
You’re following 1.x instructions. In 2.0 the MCP server embeds the
connector, so there is no second process. Delete any “start the browser tools
server” step from your setup or scripts. See the migration guide.
Issue: Not seeing any logs
Issue: Not seeing any logs
Open the Chrome DevTools console in the browser tab you want to capture logs
from, then reload the page. Confirm it is working with
--verbose, which
prints each entry as it arrives.Issue: The logs are from the wrong tab
Issue: The logs are from the wrong tab
Every tab with DevTools open is tracked separately, and tools act on the tab
you most recently opened DevTools on. Every result reports the
tabId and
url it came from, plus otherTabs. Call listBrowserTabs and pass a
tabId to target a specific one, or allTabs: true to read across all of them.Issue: I see [REDACTED] in my logs
Issue: I see [REDACTED] in my logs
That is this tool protecting you, not your app misbehaving. Credential-bearing
headers, JWTs, cloud keys and vendor tokens are scrubbed in the browser before
they are sent. Pass
--no-redact if you genuinely need raw values.Issue: Cannot see my screenshots
Issue: Cannot see my screenshots
Screenshots are saved to
~/Downloads/mcp-screenshots by default. Set another
location with --screenshot-dir <path> or BROWSER_TOOLS_SCREENSHOT_DIR.
takeScreenshot also returns the image itself to your agent, plus a
browser-tools://screenshot/{name} link.Issue: Chrome says it started debugging this browser
Issue: Chrome says it started debugging this browser
Console capture defaults to the DevTools protocol, which triggers that banner.
Switch the panel’s capture mode to Wrap page console to avoid it.
Error: audits fail or no browser is found
Error: audits fail or no browser is found
Audits launch a separate browser and take up to a minute. Any Chromium-based
browser works — Chrome, Chromium, Brave, Edge, Vivaldi, Opera or Arc — and
--doctor reports which one will be used. Set CHROME_PATH to point at a
specific binary.Issue: Logs keep disappearing
Issue: Logs keep disappearing
Captured telemetry lives in memory and is cleared when the server restarts.
Retention is per tab, so a chatty page cannot evict the history of the one you
care about.
wipeLogs clears it deliberately, for a clean reproduction.Issue: Encountering an unknown error
Issue: Encountering an unknown error
Contact @tedx_ai or open an issue on the Github repo.